
Welcome to another article on data visualization. This tutorial helps our readers on Step by Step Guide on How to Install the latest Grafana on Ubuntu 24.04 operating system. This is the latest Ubuntu release at the time of Writing.
What is Grafana?
We all know what Grafana is, don’t we ? Grafana is one of the powerful open-source analytics and dashboard platform capable of monitoring and visualizing pretty much anything right now. Grafana also queries, visualizes and understand metrics from a variety of data sources. Users are allowed to create static and dynamic dashboards, sets up alerts for their teams and analyze data from pretty much any time period from which the data was first available. Grafana is fast, reliable and user-friendly. Nowadays, Grafana is commonly used for System and services monitoring in IoT, DevOps and as well as IT Infrastructure. Grafana supports a wide variety of data sources like I have mentioned few of the data sources in the following:
- Time-Series Datasources: OpenTSDB, Prometheus and InfluxDB. (These datasources can pretty much store metrics and trace information in Timeseries format)
- Relational Databases: MySQL, PostgreSQL, MSSQL
- Cloud Services: AWS, GCP and Azure.
Key Benefits of Grafana:
Some of the key features of Grafana Includes but not limited to the following:
- Customizable Dashboards (My Personal Favorite): Creating a detailed dashboards and visualization was never been easier than this. As soon as I connect my Datasource and put some queries. Grafana can help me visualize pretty much the data I have queried in any visualization from timeseries, to stats, to Tables and what not.
- Plugins: Plugins help me get event the custom data without any worries and there are literally 100s of plugins out there to support any kind of customization.
- Alerts: Another cool feature to integrate to my slack or to my teams where Grafana can send out notification when something wrong with any of the visualization.
Pre-Requisites to Install Grafana on Ubuntu 24.04
- A fresh Ubuntu 24.04 Operating system deployed in Cloud or On-Premise
- A root user account or a user with sudo privileges.
Note: If you are looking to install Ubuntu 24.04 (Latest at the time of writing). You can check this article on How to Install Ubuntu 24.04 on Proxmox VE.
You can watch the step by step Video Tutorial Here
Step 1: System Update
The very first we generally follow after receiving or login to the fresh system is to update the system so that we receive the latest updates on the packages. To do that, use the following command on a terminal.
sudo apt update -yThis command will ensure that all the system packages are installed to the latest from the ubuntu repository.
Step 2: Install dependencies
The next step is to install the required dependencies so that we do not face any issues while installing grafana.
sudo apt-get install -y apt-transport-https software-properties-common wgetStep 3: Import the GPG Key
This step will ensure that we download the required GPG Keys from the Grafana repository and set it up locally.
sudo mkdir -p /etc/apt/keyrings/
wget -q -O - https://apt.grafana.com/gpg.key | gpg --dearmor | sudo tee /etc/apt/keyrings/grafana.gpg > /dev/null
Step 4: Add Grafana Stable Repository
The next step is to setup the grafana’s Open source stable repository in the server so that we can always update the grafana packages at a later stage. The command for that is given below.
echo "deb [signed-by=/etc/apt/keyrings/grafana.gpg] https://apt.grafana.com stable main" | sudo tee -a /etc/apt/sources.list.d/grafana.listStep 5: Update the package repository
Let us now update the package repository so that our new Ubuntu system will know that we have added a new Grafana Repository. To do that, put the following command on the linux terminal.
sudo apt-get updateStep 6: Install Grafana
This is the ultimate step to install Grafana on our Ubuntu 24.04 Operating System. Apply the following command so that the operating system pulls the required packages from the Grafana OSS Repository and installs Grafana on our Ubuntu 24.04 Operating system.
sudo apt-get install grafanaStep 7: Validate Grafana Install
We will ensure that Grafana services are started on system reboot. we will also verify that the grafana server services are started and running successfully, to do that issue the following command in the terminal.
systemctl start grafana-server
systemctl enable grafana-server
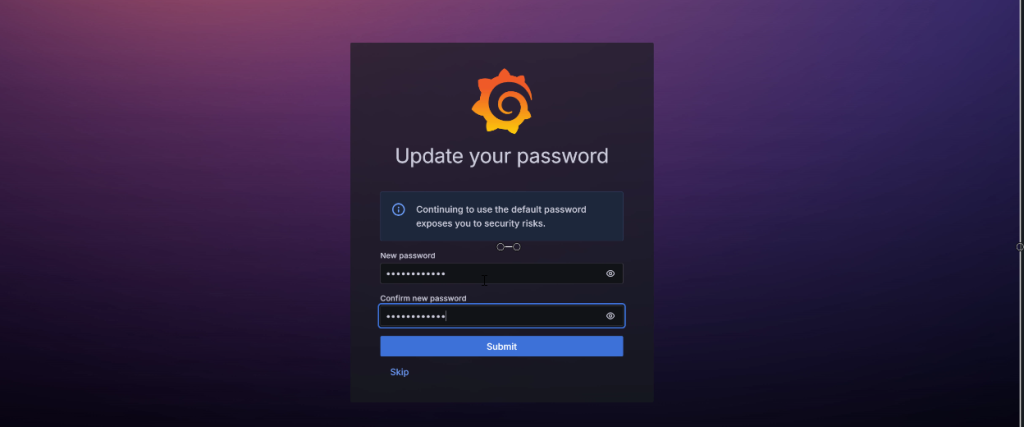
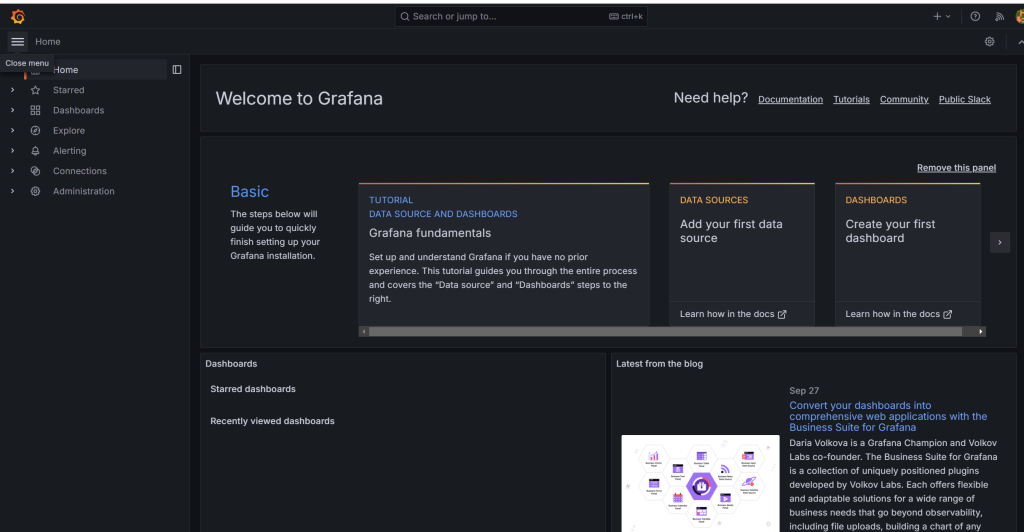
systemctl status grafana-serverStep 8: Login to Grafana UI and change the admin Password.
The final step is to login to the Grafana UI. The Grafana is generally accessible on http://Your_Server_IP:3000/
The default username and password to login to Grafana is admin / admin

Summary
In Summary, We have seen How to Install Grafana on Ubuntu 24.04 Operating system. I hope this step by step guide was really useful. See you in the next article !!!!


2 thoughts on “Step by Step Guide: How to Install Grafana on Ubuntu 24.04”