
In this latest tutorial, we will focus on how to configure Grafana with Nginx reverse proxy server. we will walk you through step by step configuration involved in both Grafana and Nginx to setup the revert proxy.
Before we begin, If you still did not setup Grafana and wanted to Setup your own Grafana instance before setting up the Reverse proxy service. Here is our Step by Step Guide to Install Grafana on Ubuntu 24.04
What is Grafana?
We all know what Grafana is, don’t we ? Grafana is one of the powerful open-source analytics and dashboard platform capable of monitoring and visualizing pretty much anything right now. Grafana also queries, visualizes and understand metrics from a variety of data sources. Users are allowed to create static and dynamic dashboards, sets up alerts for their teams and analyze data from pretty much any time period from which the data was first available. Grafana is fast, reliable and user-friendly. Nowadays, Grafana is commonly used for System and services monitoring in IoT, DevOps and as well as IT Infrastructure.
Pre-Requisite for Configuring Grafana with Nginx.
- Operating System with Grafana Installed. (We are using Ubuntu 24.04 for this Tutorial)
- sudo privileged user to setup nginx
If you want to Skip right to a detailed Video demonstration of the entire process. Here is a link to our Video Tutorial.
Step 1: Check Nginx Status
The first and foremost step is to validate that if we have Nginx already installed on the server. to do that, Issue the following command.
nginx -v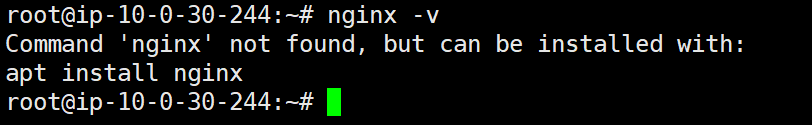
This should show an output similar to the above. This means that nginx is not already installed on the server and we need to install nginx to proceed further.
Step 2: Install Nginx
To Install nginx in Ubuntu or any Debian based operating system, Issue the following command.
sudo apt-get install nginx -y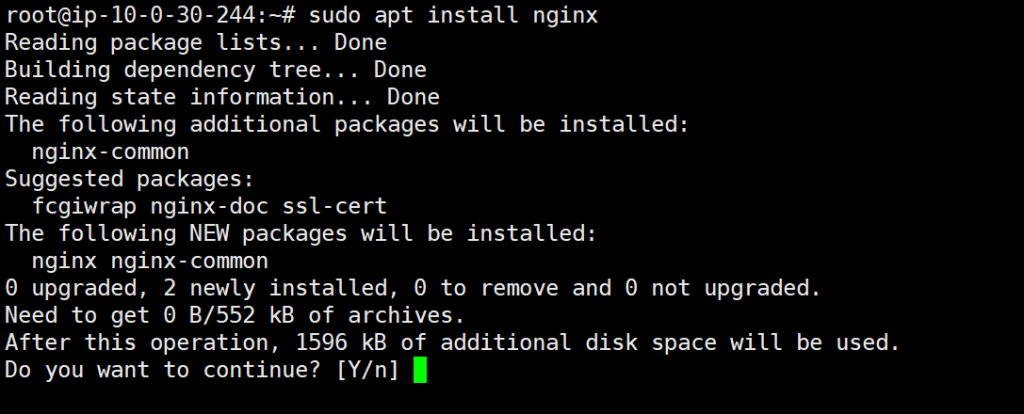
The above command will help you install Nginx into your system.
You can also validate whether nginx has successfully installed on your server with the following commands
nginx -v
systemctl status nginx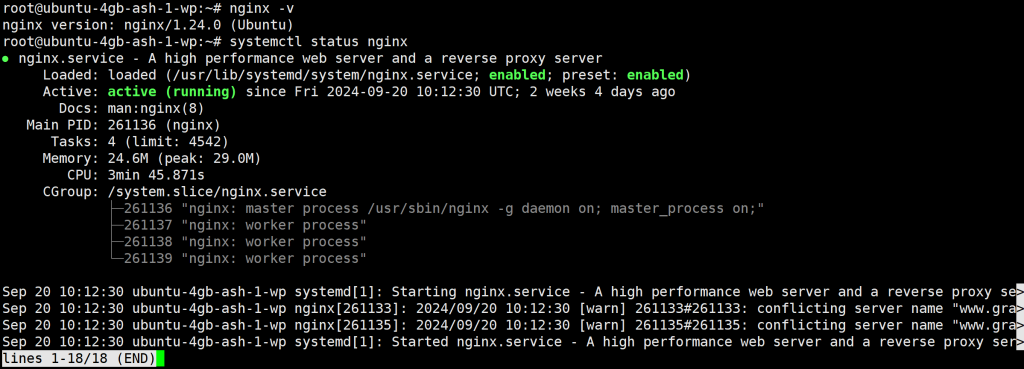
This will produce an output similar to the above.
Step 3: Configuring Grafana
A small configuration step is involved in Grafana to make sure the reverse proxy works perfect. we have to edit the grafana ini files located in /etc/grafana/grafana.ini
domain = <Your Domain Name>add the above line under the [server] section in grafana.ini file.
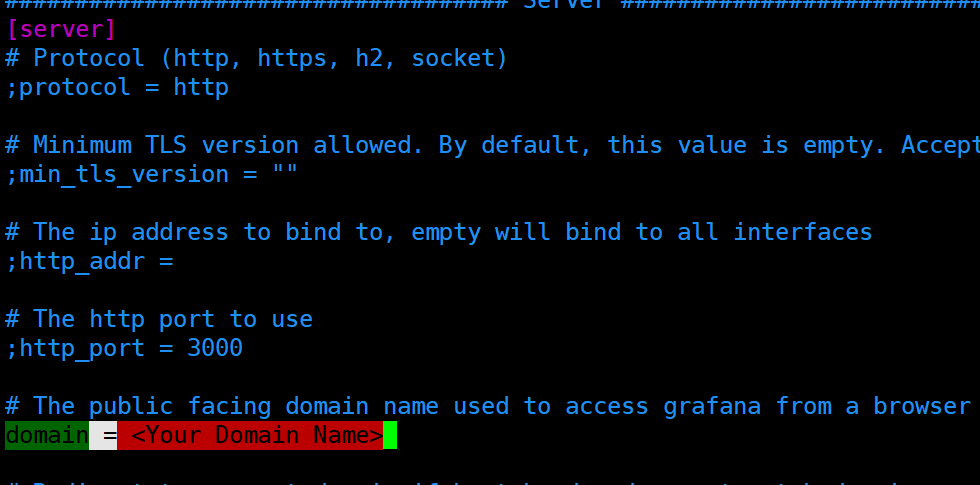
This will look like above. Once done save and close the file.
Step 4: Configuring Nginx for Reverse Proxy
In this step, we have to create a new configuration file for grafana in the nginx sites-enabled directory and add few lines of configuration. To do that, issue the below commands
vim /etc/nginx/sites-enabled/Your_domain_name.confOnce the files is opened, Pasted the below content in the file.
server {
    listen 80;
    listen [::]:80;
    server_name  YOUR-DOMAIN-NAME;

    location / {
        proxy_pass           http://localhost:3000/;
    }
}
Be sure to change the Domain name to your Domain name or Public IP. Once Done, save and close the file.
Step 5: Restart Nginx and Confirm
The last step is to make sure the changes are taken into affect. For that we have to restart both Nginx and Grafana Services. To do that, issue the below command.
systemctl restart grafana-server
systemctl restart nginx
The above commands will make sure that the configuration are taken into effect. now if you open your browser and just point to your Domain Name or Public IP like http://Your_Domain_name. You should see the Grafana Login Page.
I hope you enjoy my tutorial, Feel free to add you comments and share this on your social media to make sure we deliver more quality contents.